An LLM-orchestrated, self-correcting framework for autonomous exploratory data analysis. Upload a CSV/JSON dataset and a LangGraph multi-agent pipeline generates research questions, writes and repairs its own analysis code in a sandbox, picks visualizations, and produces insight narratives — evaluated as a research question about whether RAG improves question relevance and actionability.
DataMind takes a raw dataset from upload to explained insight with minimal human input, while doubling as a controlled research testbed comparing RAG-augmented vs. baseline question generation.
Accepts CSV/JSON datasets, computes schema, stats and correlation summaries, and stores a profile before any LLM call is made.
An LLM generates dataset-specific research questions split into Pre-processing and EDA categories — optionally grounded by RAG retrieval of similarly-shaped past datasets.
For each question, a LangGraph pipeline writes pandas code, runs it in a sandbox, and — on failure — automatically corrects and retries before giving up.
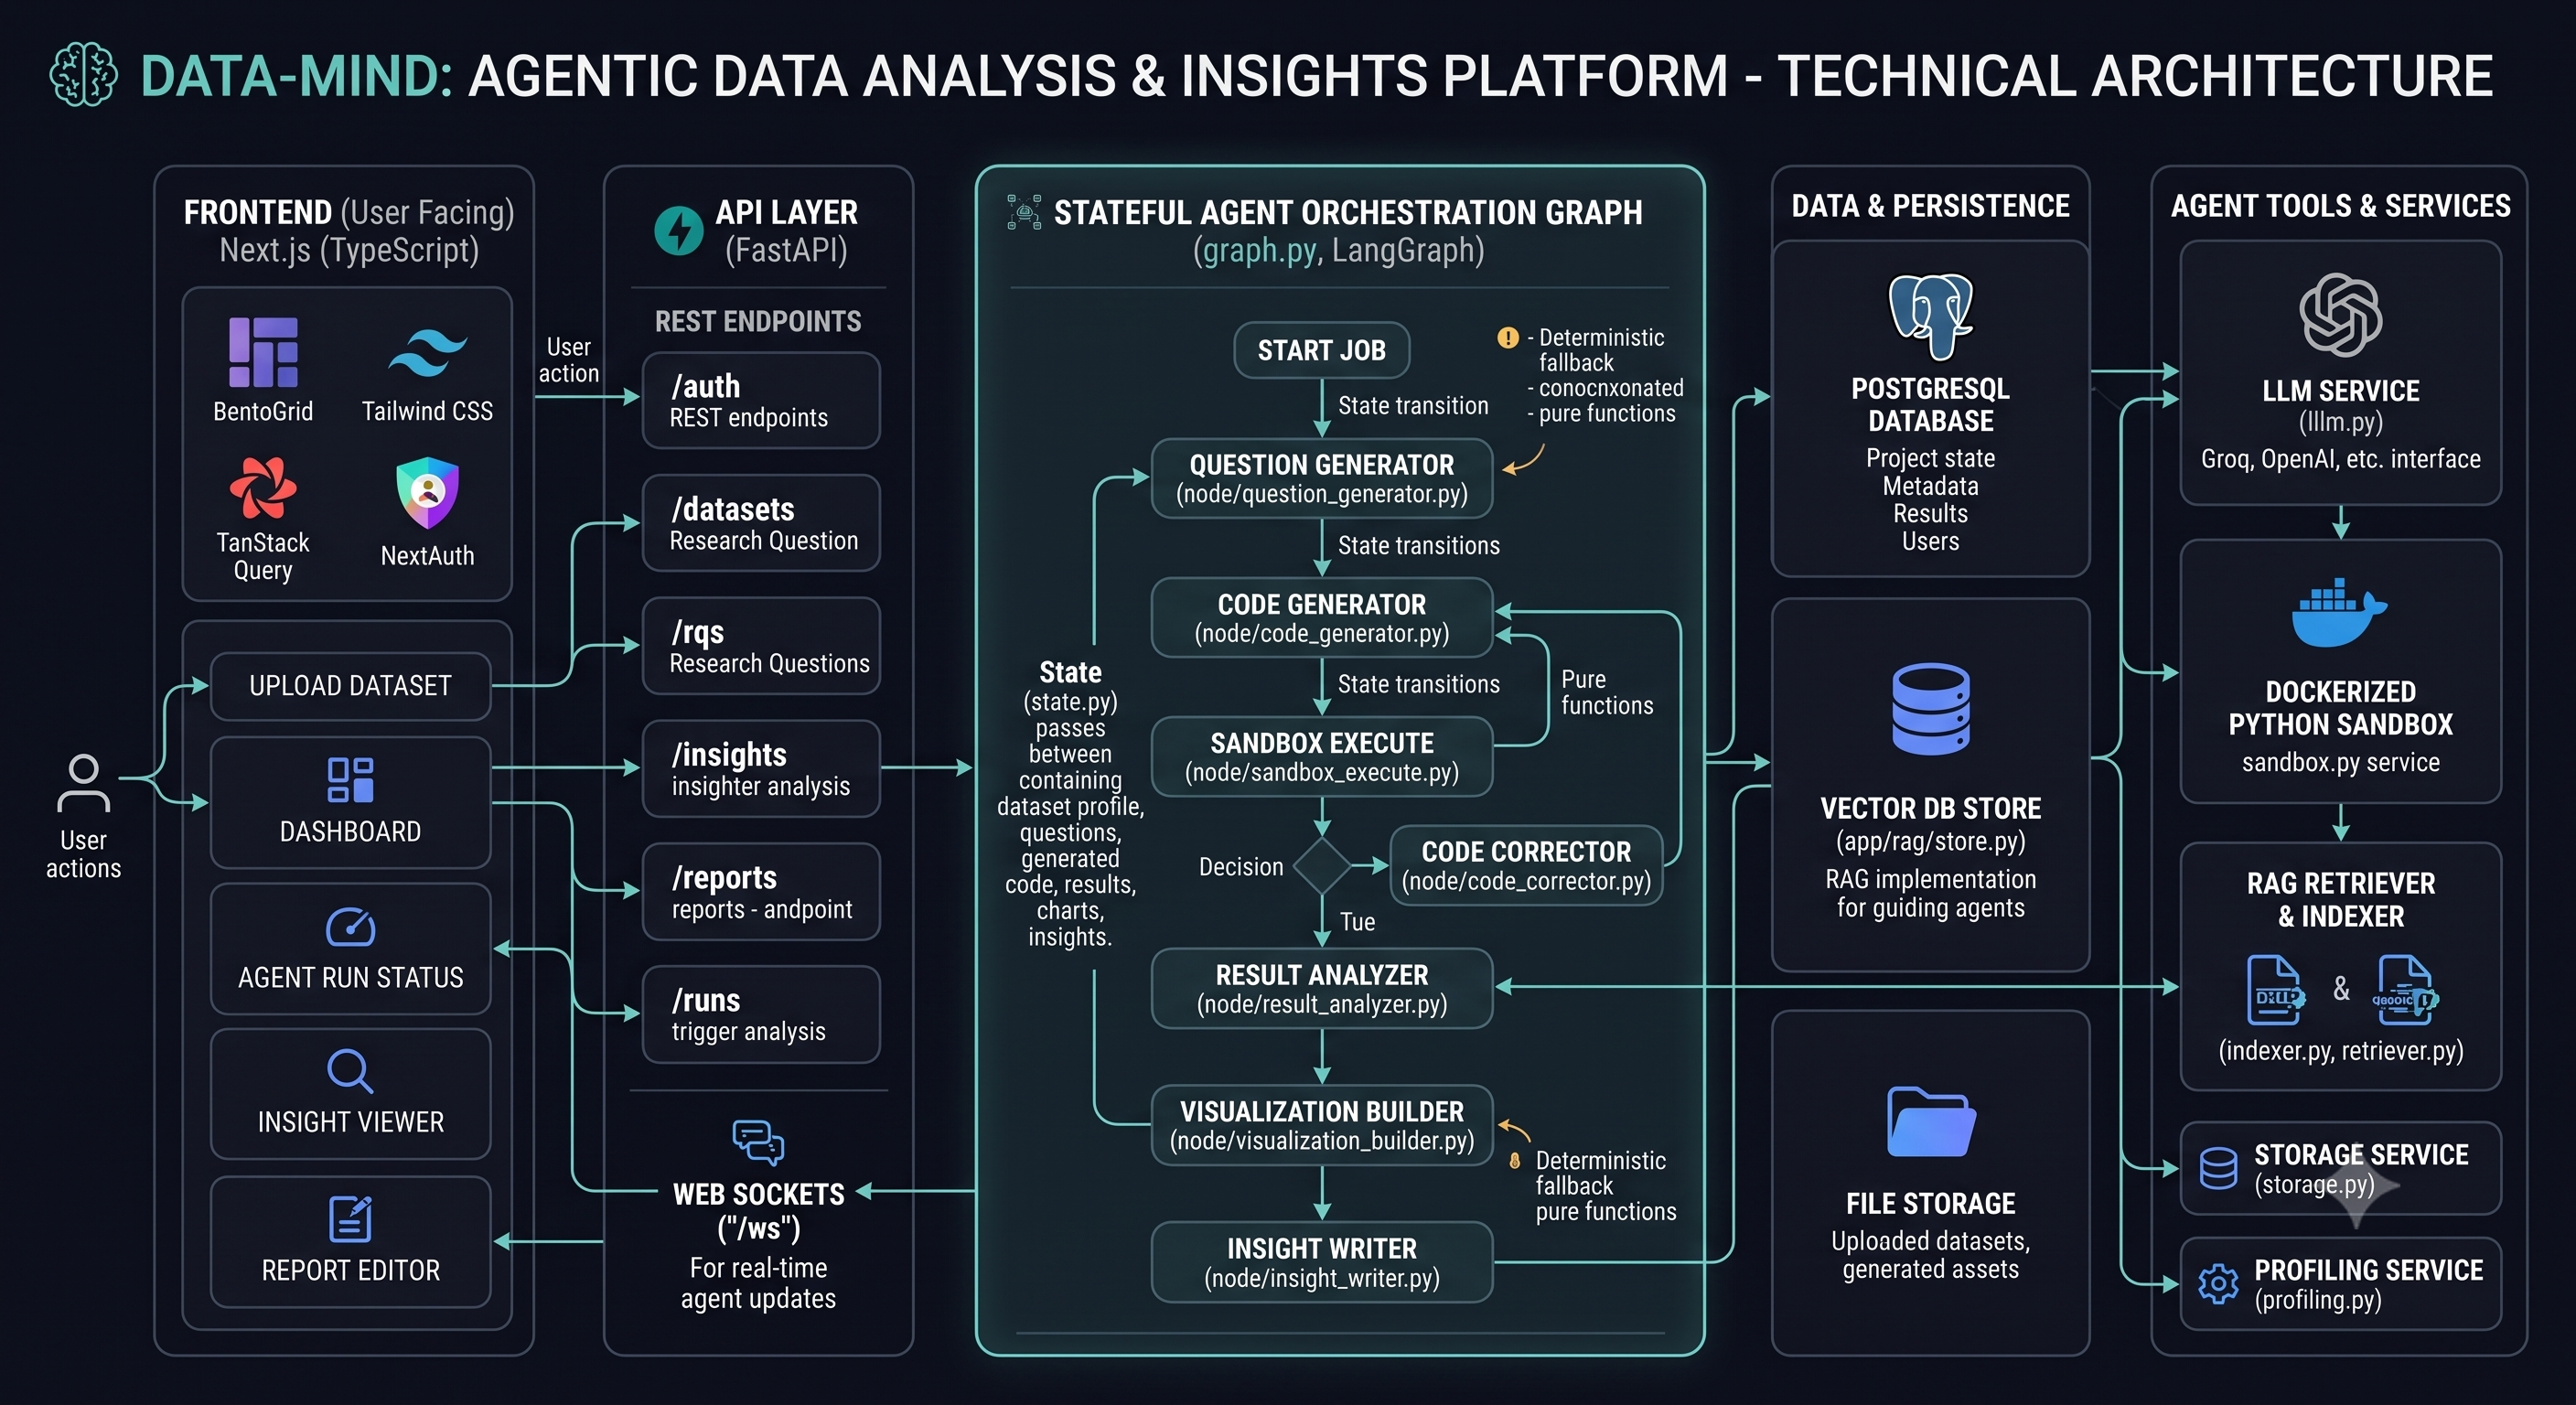
A LangGraph agent graph owns the reasoning loop, a FastAPI service layer owns persistence and orchestration, and a local ChromaDB store provides zero-cost RAG grounding — deliberately Docker-free and API-budget-conscious.
question_generator is deliberately kept outside the per-run LangGraph graph — it runs once per dataset, while the compiled graph (code_generator → sandbox_execute → result_analyzer → insight_writer → visualization_builder, with a code_corrector retry loop) runs once per research question. This keeps "generate N questions" state from ever mixing with "answer 1 question" state.
The canonical path a dataset travels from upload to a downloadable report.
A CSV/JSON file is uploaded, or fetched via direct URL / the Kaggle API through the Dataset Fetch Service. The raw file is persisted and a Dataset row is created.
The profiling service computes a schema summary, stats summary, correlation summary and sample rows — metadata only, never raw rows beyond a bounded sample — stored as a DatasetProfile.
question_generator calls the LLM once per dataset to produce a batch of dataset-specific questions, split into Pre-processing and EDA categories, each with target columns, expected output type and rationale. RAG retrieval can ground this call with insights from similarly-shaped past datasets.
For each selected ResearchQuestion, an AnalysisRun starts the LangGraph pipeline: code_generator writes pandas code from the question + profile context.
sandbox_execute runs the code as an isolated subprocess (fresh working dir, CPU/memory rlimits, wall-clock timeout, network disabled best-effort). On failure, code_corrector rewrites the code using the traceback and loops back to execution — until success or max_attempts is exhausted, at which point the run is marked failed.
result_analyzer is a deterministic (non-LLM) node that truncates/sanitizes stdout (max 4000 chars) so downstream LLM calls get clean, bounded input — logic kept in one place instead of duplicated across nodes.
insight_writer turns the execution output into a narrative Insight. visualization_builder asks the LLM only for chart metadata (type/title/labels) — the PNG itself is rendered by the sandboxed script per the code-generator's contract (./output/chart.png) — and is skipped entirely if no chart was produced.
On a successful run, the new insight is written into the local Chroma vector store by the RAG indexer, keyed on the dataset's "schema text" embedding — so future datasets with a similar shape can retrieve it. Indexing failure never fails the run itself.
Once enough runs complete, a Report is generated summarizing insights and visualizations for the dataset, downloadable alongside the cleaned/pre-processed dataset.
Each node is a focused async function operating on a shared AnalysisState TypedDict — LLM-calling nodes load their system prompt from a dedicated markdown file under app/agents/prompts/.
Runs once per dataset (not per run), invoked directly from POST /datasets/{id}/questions. Produces a structured ResearchQuestionBatch split into Pre-processing and EDA categories, each tagged with target columns and rationale.
First node of the per-run graph. Writes pandas analysis code for one research question, using dataset profile context (schema/stats/correlation summaries + sample rows) and, optionally, retrieved similar past insights.
Runs the latest generated code in the local, Docker-free sandbox (services/sandbox.py) against the real dataset file, capturing stdout/stderr, exit code, duration and any produced output files (e.g. chart.png).
Branches on the execution result: success → result_analyzer; failure with attempts remaining → code_corrector; attempts exhausted → give_up, which marks the run failed and stores the last stderr.
Given the failing code and its traceback, asks the LLM for a corrected version, appends it to code_history, and loops back to sandbox_execute — the self-correction retry loop, bounded by max_attempts.
Deterministic, no LLM call. Truncates/sanitizes the successful execution's stdout to a bounded size so both insight_writer and visualization_builder receive clean input without duplicating that logic.
Converts the sanitized execution output into a natural-language Insight row tied to the research question and run.
Asks the LLM only for structured chart metadata (type, title, axis labels) describing a chart the sandboxed script already rendered to disk; the node is skipped entirely when no chart file was produced.
A Docker-free, local persistent Chroma client paired with a local sentence-transformers embedding model — indexing and retrieval cost zero API tokens, which matters because RAG runs on every question-generation and insight-writing call.
Finds past insights whose source dataset had a similar schema shape, using a synthetic "schema text" (column names + dtypes) embedding as an approximation of dataset similarity — an intentionally simple heuristic, documented for future replacement.
Writes each completed insight into the local store right after its AnalysisRun succeeds and commits. Best-effort by design — a failure here must never fail the run itself.
Handles ingestion from a direct URL or the Kaggle API, normalizing both into the same on-disk raw-dataset representation the rest of the pipeline expects.
A single get_llm(model_name) factory; active provider is Ollama (fully local, zero API keys, models like gemma3:4b/phi4-mini/qwen2.5:3b), with commented-out swap points for Groq, OpenAI and Gemini for production/evaluation runs.
Lightweight local-user login (LocalUser model), JWT-style session for a single-user research prototype.
A WebSocket endpoint (api/ws.py) pushes job/run status updates to the frontend in real time as the graph progresses.
A dedicated RunMetrics table captures token cost and outcome per run — feeding the RAG-vs-baseline research comparison.
Downloadable cleaned/pre-processed dataset and an auto-generated summary report, per the project's stated feature set.
Grouped by app/api/* router modules. Filter by domain.
| Method | Endpoint | Purpose |
|---|---|---|
| POST | /auth/login | Authenticate local user, issue session |
| POST | /datasets | Upload/register a new dataset |
| GET | /datasets | List datasets |
| GET | /datasets/{dataset_id} | Fetch a single dataset |
| GET | /datasets/{dataset_id}/profile | Schema/stats/correlation profile |
| POST | /datasets/{dataset_id}/questions | Trigger LLM research-question generation |
| GET | /datasets/{dataset_id}/questions | List generated research questions |
| POST | /datasets/{dataset_id}/runs | Kick off one or more per-question analysis runs (LangGraph) |
| GET | /datasets/{dataset_id}/runs | List analysis runs and their status |
| GET | /datasets/{dataset_id}/insights | List insights produced for the dataset |
| GET | /datasets/{dataset_id}/insights/{insight_id}/visualization | Fetch the chart metadata tied to an insight |
| POST | /datasets/{dataset_id}/report | Generate the dataset summary report |
| GET | /datasets/{dataset_id}/report | Fetch the generated report |
| WS | /ws | Live push of job/run status to the frontend |
Every layer was deliberately chosen to run Docker-free and token-cost-free where possible, given the project's API-budget constraints as a research prototype.
Earlier planning targeted PostgreSQL + pgvector and a paid LLM API (per the project's own memory notes). The shipped local-pipeline milestone consolidated onto SQLite + Ollama + ChromaDB — a fully local, zero-API-cost stack better suited to iterating on the RAG-vs-baseline research comparison without burning a token budget, with the cloud providers kept as drop-in swaps for the final evaluation run.
The full schema lives in backend/app/db/models.py, versioned via Alembic (backend/migrations/).
Every AnalysisRun links to exactly one ResearchQuestion and accumulates one or more GeneratedCode / ExecutionAttempt rows — a full audit trail of every self-correction cycle the agent went through.
Derived from the full git commit tree (git log --author, --numstat, --name-only) across 19 commits on main, spanning Jul 17 – Sep 11, 2026.
Owned the entire backend: project bootstrap, phased backend build-out, and the full LangGraph multi-agent pipeline + RAG integration.
Built the entire frontend from scratch through to live-data integration — auth, every core screen, and the final backend-polling wire-up.
The project began July 17, 2026 as "SmartBI" (renamed DataMind the same day). Jalisa built out the complete frontend against mocked data through late July/early August, while Swayam's backend work proceeded in phases (foundation → partial phase-3 handover) before a large Sep 11 commit landed the full LangGraph pipeline, RAG integration, and a local-only Ollama/ChromaDB/SQLite setup — bringing backend and frontend into alignment for the first time.
An illustrative walkthrough of the core screens and agent behavior, built from the actual state machine and prompts above (sample data — not a live connection to the running app).
| Column | Dtype | Nulls | Notes |
|---|---|---|---|
| order_date | datetime | 0% | Range: 2023-01 → 2026-06 |
| unit_price | float64 | 0.4% | Right-skewed, 3 outliers |
| customer_segment | category | 1.1% | 5 unique values |
| discount_pct | float64 | 6.7% | Correlates with churn_flag (0.61) |
| Chart | Type | Status |
|---|---|---|
| discount_vs_churn.png | Grouped bar | Rendered |
| order_value_trend.png | Line | Rendered |
| Retrieved past insight | Source dataset shape | Similarity |
|---|---|---|
| "Discount depth correlates with early churn in subscription data" | 12 cols, similar dtypes | 0.84 |
| "Outlier prices cluster around bulk-order thresholds" | 9 cols, partial overlap | 0.62 |